
PhD student Kyoko Watanabe from CTGlab publishes in Nature Communications
A main challenge in genome-wide association studies (GWAS) is to interpret statistical findings in biological context. Post-GWAS annotation facilitates this task yet currently available tools can be time consuming and do not provide integrated visual aids for data interpretation. PhD student Kyoko Watanabe from the Department Complex Trait Genetics developed FUMA: an integrative web-based platform using information from multiple biological resources to facilitate functional annotation of GWAS results, gene prioritization and interactive visualization. The accompanying paper was published this week in Nature Communications.
GWAS studies have yielded many statistical associations to a variety of traits. Interpreting these associations and generating functional hypotheses that can be tested in wet-lab experiments, is a major challenge. This is especially challenging for complex traits where multiple genetic variants each of small effect are causally involved. Annotation of associated variants with biological information may aid in understanding the biological relevance of GWAS findings. However, such annotation requires the combination of multiple data resources as well as interpretation of huge amounts of annotated data. FUMA is a web-based, easy to use tool that only requires to upload GWAS summary statistics. It will then carry out functional annotation of lead variants as well as variants that are correlated with these. This provides information on whether associated variants e.g. lead to truncated proteins, over-expression of a gene in a certain tissue or whether multiple variants are linked via a common functional pathway. All annotated results are visualized to facilitate interpretation. The results of FUMA can be translated into testable functional hypothesis and aid in uncovering mechanistic pathways underlying human traits and diseases.
The tool can be accessed via the FUMA website.
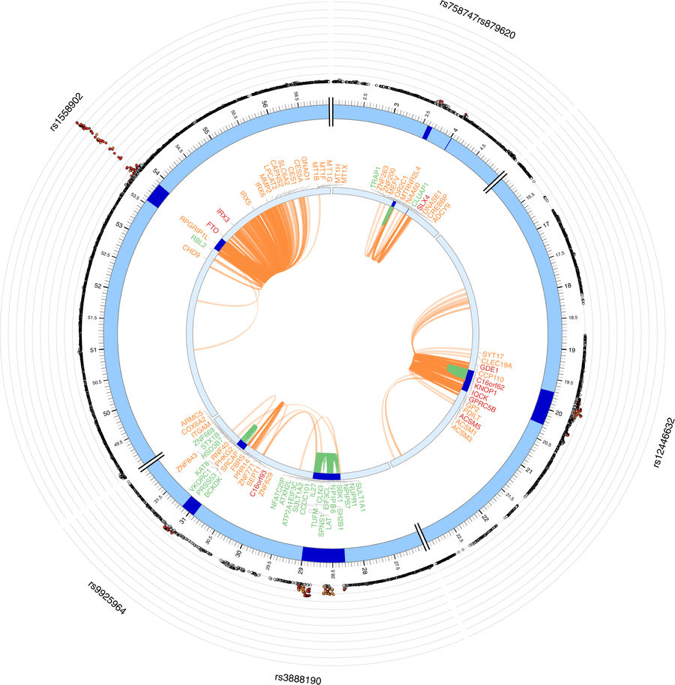
Figure: Example of chromatin interactions and eQTLs.
The most outer layer is the Manhattan plot displaying SNPs with P-value < 0.05. Candidate SNPs are colored based on the highest r 2 to one of the independent significant loci (red: r 2 > 0.8, orange: r 2 > 0.6). Other SNPs are colored in gray. rsID of top SNPs per locus are labeled. The outer circle is the chromosome coordinate and genomic risk loci are highlighted in blue. Genes mapped by either Hi-C or eQTLs are shown on the inner circle. Genes mapped by Hi-C, eQTLs are colored orange and green, respectively. Genes mapped by both are colored red. Chromatin interaction and eQTLs are shown as links colored orange and green respectively (Watanabe et al., Nat Comm, 2017)
The publication is available from Nature Communications.