PhD student Kyoko Watanabe (CNCR-CTG) publishes a novel way of using single cell gene expression data to prioritize cell types in disease. Her paper features as Editor’s highlight in Nature Communications
Genome-wide association studies (GWASs) have identified tens of hundreds of genetic variants associated with a variety of complex traits. Despite the success in identification of trait-associated variants, gaining insight into causal biological mechanisms remains challenging.
In this study we propose a novel way to assess whether the multiple genes associated with a particular trait can indicate whether specific types of cells are more likely to be involved in the trait than other traits. We do so by using information obtained so-called single-cell RNA sequencing (scRNA-seq) experiments, that provide insight into the expression patterns of thousands of genes across multiple types of cells. By overlaying these expression patterns with the strength of the statistical associations of genes with traits, we gain insight into trait-specific involvement of cell types. The novel method uses scRNAseq data from > 40 human and mouse resources, and combines evidence from each of these resources through sophisticated conditional cell-type specificity analyses. The method is implemented in the online webtool FUMA to facilitate this type of analyses for all researchers that have generated GWAS results.
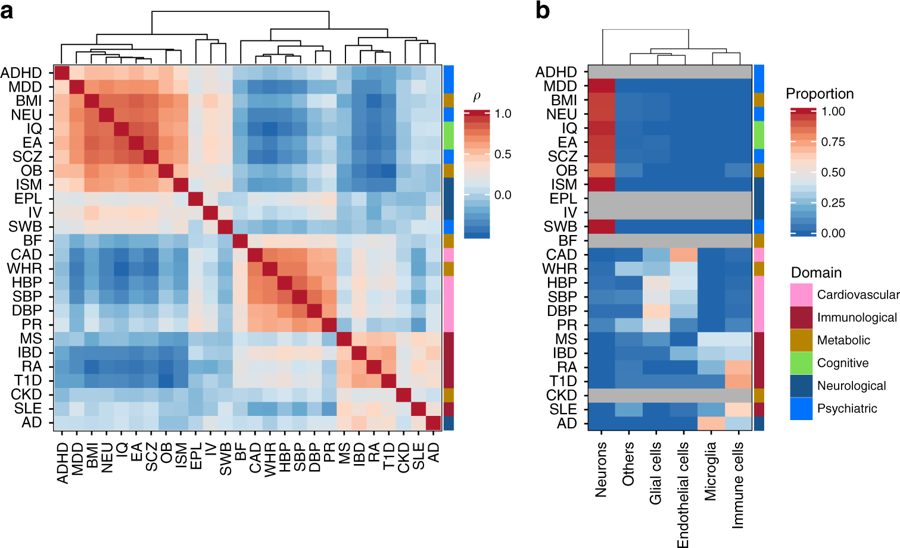
From: Watanabe et al. 2019: Similarity of cell type association patterns across 26 traits. a Pair-wise Spearman’s rank correlation of cell type association P-values from step 1. Traits are clustered based on the pair-wise correlation matrix using the hierarchical clustering. b Significantly associated main category of cell types per trait. The heatmap is colored by the proportion of significantly associated cell types (P < 0.05/2679) in each category of cell types per trait. Traits with no significant association are colored gray and the traits are in the same order as a. The color bar at the right of the heatmap represents the domain of the traits. P-values for specific cell types per trait are available in Supplementary Data 5
The study is published in Nature Communications and features as an editor’s highlight.
Watanabe K, Umićević Mirkov M, de Leeuw C, van den Heuvel MP, Posthuma D. Genetic mapping of cell type specificity for complex traits. Nature Communications, 2019 Jul 19;10(1):3222. doi: 10.1038/s41467-019-11181-1.
